

Real Results
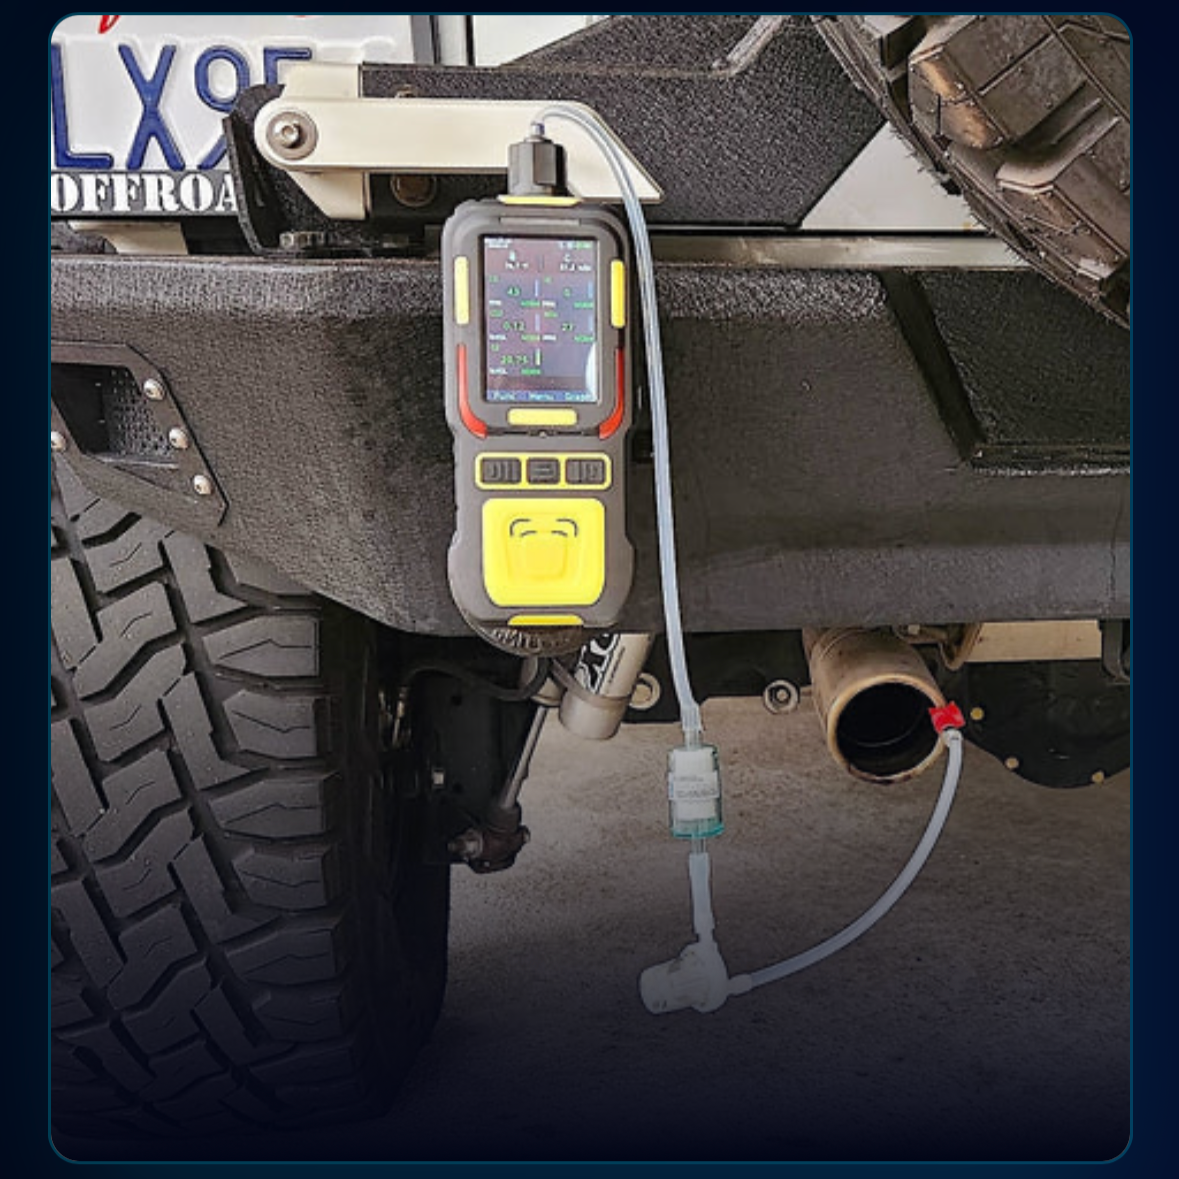
Measured before and after every clean with a 5-gas analyser. The figures below are HC (hydrocarbons) in parts per million — the key indicator of carbon buildup.
| Vehicle | Before (HC ppm) | After (HC ppm) | Reduction |
|---|---|---|---|
| 2018 Mazda CX-5 2.5L | 7,660 | 1,945 | 75% |
| 1995 Ford Mustang 3.8L | 3,002 | 2,099 | 30% |
| 2015 Jeep Wrangler 3.6L | 8,500 | 4,195 | 51% |
Every clean comes with your own before-and-after readings on paper. Results vary by engine — these are real readings from real jobs, not promises.